Data can be replicated across any available network. In Wide Area Network (WAN) configurations, special consideration must be given to the question, “Is there sufficient bandwidth to successfully replicate the partition and keep the mirror in the mirroring state as the source partition is updated throughout the day?”
Keeping the mirror in the mirroring state is critical because a switchover of the partition is not allowed unless the mirror is in the mirroring state.
Short bursts of write activity are handled by adding the data to the async queue. However, make sure that over any extended period of time, the disk write activity for all replicated volumes combined remains, on average, below the amount of change that your network can transmit.
If the network capacity is not sufficient to keep up with the rate of change that occurs on your disks, and the async queue fills up, the mirror will revert to synchronous behavior, which can negatively affect performance of the source server.
Measuring Basic Rate of Change
Use the following command to determine file(s) or partition(s) to be mirrored. For example /dev/sda3, and then measure the amount of data written in a day:
MB_START=`awk ‘/sda3 / { print $10 / 2 / 1024 }’ /proc/diskstats`
… wait for a day …
MB_END=`awk ‘/sda3 / { print $10 / 2 / 1024 }’ /proc/diskstats`
The daily rate of change, in MB, is then MB_END – MB_START.
SIOS DataKeeper can mirror daily, approximately:
T1 (1.5Mbps) – 14,000 MB/day (14 GB)
T3 (45Mbps) – 410,000 MB/day (410 GB)
Gigabit (1Gbps) – 5,000,000 MB/day (5 TB)
Measuring Detailed Rate of Change
The best way to collect Rate of Change data is to log disk write activity for some period of time (one day, for instance) to determine what the peak disk write periods are.
To track disk write activity, create a cron job which will log the timestamp of the system followed by a dump of /proc/diskstats. For example, to collect disk stats every two minutes, add the following link to /etc/crontab:
*/2 * * * * root ( date ; cat /proc/diskstats ) >> /path_to/filename.txt
… wait for a day, week, etc … then disable the cron job and save the resulting data file in a safe location.
Analyze Collected Detailed Rate of Change Data
The roc-calc-diskstats utility analyzes data collected in the previous step. This utility takes a /proc/diskstats output file that contains output, logged over time, and calculates the rate of change of the disks in the dataset.
Click Here to download roc-calc-diskstats
Usage:
# ./roc-calc-diskstats <interval> <start_time> <diskstats-data-file> [dev-list]
Usage Example (Summary only):
# ./roc-calc-diskstats 2m “Jul 22 16:04:01” /root/diskstats.txt sdb1,sdb2,sdc1 > results.txt
The above example dumps a summary (with per disk peak I/O information) to results.txt
Usage Example (Summary + Graph Data):
# export OUTPUT_CSV=1
# ./roc-calc-diskstats 2m “Jul 22 16:04:01” /root/diskstats.txt sdb1,sdb2,sdc1 2> results.csv > results.txt
The above example dumps graph data to results.csv and the summary (with per disk peak I/O information) to results.txt
Example Results (from results.txt)
Sample start time: Tue Jul 12 23:44:01 2011
Sample end time: Wed Jul 13 23:58:01 2011
Sample interval: 120s #Samples: 727 Sample length: 87240s
(Raw times from file: Tue Jul 12 23:44:01 EST 2011, Wed Jul 13 23:58:01 EST 2011)
Rate of change for devices dm-31, dm-32, dm-33, dm-4, dm-5, total
dm-31 peak:0.0 B/s (0.0 b/s) (@ Tue Jul 12 23:44:01 2011) average:0.0 B/s (0.0 b/s)
dm-32 peak:398.7 KB/s (3.1 Mb/s) (@ Wed Jul 13 19:28:01 2011) average:19.5 KB/s (156.2 Kb/s)
dm-33 peak:814.9 KB/s (6.4 Mb/s) (@ Wed Jul 13 23:58:01 2011) average:11.6 KB/s (92.9 Kb/s)
dm-4 peak:185.6 KB/s (1.4 Mb/s) (@ Wed Jul 13 15:18:01 2011) average:25.7 KB/s (205.3 Kb/s)
dm-5 peak:2.7 MB/s (21.8 Mb/s) (@ Wed Jul 13 10:18:01 2011) average:293.0 KB/s (2.3 Mb/s)
total peak:2.8 MB/s (22.5 Mb/s) (@ Wed Jul 13 10:18:01 2011) average:349.8 KB/s (2.7 Mb/s)
Graph Detailed Rate of Change Data
To help understand your specific bandwidth needs over time, SIOS has created a template spreadsheet called diskstats-template.xlsx. This spreadsheet contains sample data which can be overwritten with the data collected by roc-calc-diskstats.
Click Here to download diskstats-template.xslx
- Open results.csv, and select all rows, including the total column.
- Open diskstats-template.xlsx, select the diskstats.csv worksheet.
- In cell 1-A, right-click and select Insert Copied Cells.
- Adjust the bandwidth value in the cell towards the bottom left of the worksheet to reflect an amount of bandwidth you have allocated for replication.
Units: Megabits/second (Mb/sec)

- Make a note of the following row/column numbers:
a. Total (row 6 in screenshot below)
b. Bandwidth (row 9 in screenshot below)
c. Last datapoint (column R in screenshot below)

- Select the bandwidth vs ROC worksheet.

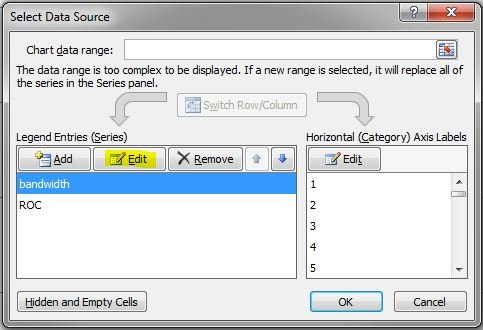
- Right-click on the graph and select Select Data…
a. Adjust Bandwidth Series
i. From the Series list on the left, select bandwidth
ii. Click Edit

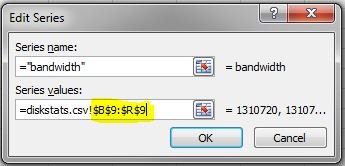
iii. Adjust the Series Values: field with the following syntax:
“=diskstats.csv!$B$<row>:$<final_column>$<row>”
example: “=diskstats.csv!$B$9:$R:$9”

iv. Click OK
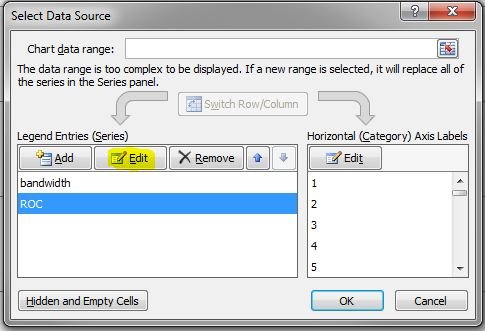
b. Adjust ROC Series
i. From the Series list on the left, select ROC
ii. Click Edit

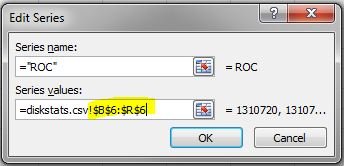
iii. Adjust the Series Values: field with the following syntax:
“=diskstats.csv!$B$<row>:$<final_column>$<row>”
example: “=diskstats.csv!$B$6:$R:$6”

iv. Click OK
c. Click OK to exit the Wizard
- The Bandwidth vs ROC graph will update. Please analyze your results to determine if you have sufficient bandwidth to support replication of your data.


Post your comment on this topic.